
Affinity Diagramming Makerspaces
The EiTM Lab is working with Horizon Productions to begin the development of a virtual reality makerspace! The Lab is currently in the 2nd phase of the Equity in the Making: Investigating Spatial Arrangements of Makerspaces and Their Impact on Diverse User Populations project. During this phase, the Lab will work with Horizon Productions to develop the VR makerspace environment. The environment is a critical feature of the design study: the Lab will capture real-time reactions, thoughts, and impressions of students entering a makerspace for the first time.
During a recent visit to the UNC Chapel Hill campus, Horizon Productions came and checked out the EiTM Lab and two BeAM makerspaces. The goal of their visit was to gain a better understanding of this fundamental question: What should the VR makerspace look like? To answer their question, we drew from the findings from our first phase of the project and Rachel Rodney (EiTM Research Assistant) created an affinity diagram based on 14 out of the 19 makerspaces found in universities across North Carolina. Some of the makerspaces did not have images on their websites or social media, and were omitted.
Rodney visited both the makerspaces’ websites and Instagram accounts to compile images that reflected each of the spaces. The images were organized into an affinity diagram; a way to organize the images based on similarities to see what components were included in makerspaces. For example, if pictures included 3D printers, they would go into one category under types of tools. Or, if the picture showed the whole makerspace, they would go into a category together under space configuration. By grouping images by similarity, Rodney was able to identify commonalities between spaces that would lead to defining what components built a makerspace. The diagram resulted in 6 categories:
- Space Configuration. This category showed ways that makerspaces were organized.
- Tool Stations. Each makerspace showed “tool stations” which were established places that users could 3D print, solder, etc.
- Coworking Space. Centered in each makerspace were tables for users to collaborate and create things.
- Presentation Space. Some of the makerspaces included areas where people could present their work and progress.
- Computer Stations. Some machines often found in makerspaces, such as laser cutting and 3D printing, require the use of a computer. Makerspaces had computer stations that people could use to interact with the machines.
- Project Display. An area where previous projects, or project ideas, are shown.
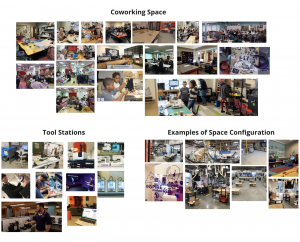
Example of some categories in the affinity diagram
Top 3 Findings
Based on the categories, Rodney defined some findings that informed general findings about university makerspaces:
- Most makerspaces include a coworking space, computer station, and tool stations. This shows that makerspaces prioritize both the ability to work with their tools, as well as open spaces to continue working on the project or to collaborate.
- The size of the space can inform on the type of tools the space is geared towards. Smaller spaces cater more towards tech projects, including 3D printing, laser cutting, soldering, etc. Larger spaces are more organized for sculpting or wood working.
- Coworking spaces include tables in the center of the room, with tools and materials surrounding it, showing that ‘making’ is the priority.
Using these findings, Horizon will be able to develop a Virtual Reality makerspace that includes typical tools and spaces within which students might encounter in university makerspaces. This will enable the EiTM Lab to research the everyday information seeking practices of students from underrepresented STEM communities.

